
Let’s face it. The internet has created a lot of self-proclaimed “digital marketing experts” who probably still use a flip phone and wish they could make Netscape Navigator their default web browser (Okay, that’s probably a stretch, but you get my point). When it comes to digital marketing, in particular, eCommerce PPC management, who are you going to trust? Some self-proclaimed “expert” cranking out blogs in his basement or an actual expert that manages eCommerce PPC campaigns day in and day out for a portfolio of clients?
Think about it this way…if you need a knee replaced, who would you want to perform your surgery? A world-class surgeon who’s performed more knee replacements than they can count or a first-year resident who may or may not know their #10 blades from their forceps? (If you’re of sane mind, I’m going to assume you chose the former!)
While there’s a TON of content out there on how to build and measure an effective eCommerce PPC campaign, most of it isn’t reliable. Any Joe Schmoe can tell you how to execute a campaign, but does Mr. Schmoe really know what KPIs (key performance indicators) for PPC matter and how to drive results? No offense to Joe, but probably not.
To help you combat all of the misinformation out there, we put together this guide that outlines the 5 PPC KPIs you MUST be tracking as part of your eCommerce PPC management strategy. These aren’t your run-of-the-mill metrics like impressions, clicks, etc. These are the key performance indicators our PPC team uses to drive revenue for our hundreds of successful eCommerce clients.
Think of this as your sneak peek behind the curtain of a leading eCommerce PPC agency. No Joe Schmoes here!
So without further ado, let’s dive in!
Why You Shouldn’t Use Conversion Value As Your Primary PPC KPI
Before we get into the nitty-gritty about the metrics that are most indicative of your PPC campaign’s success, we wanted to debunk a common misconception about conversion value.
For many, conversion value is the primary KPI for PPC that speaks to the overall success of your PPC campaign, but that can be incredibly misleading if not looked at in context. At the end of the day, conversion value only measures total revenue generated—without taking into consideration how much you’re spending.
Sure, that’s great if you made $1,000,000, but not if you spent $2,000,000. I’m no accountant, but an ROI like that wouldn’t look so great to your CFO.
Bottom line: conversion value should ABSOLUTELY NOT be used as your primary KPI when it comes to your eCommerce PPC strategy.
The 5 Most Critical KPIs For Your eCommerce PPC Campaign
Now that we’ve debunked that common myth, let’s get into the five PPC KPIs you should be laser-focused on:
- Conv. Value / Cost
- Conv. Rate
- Cost / Conv.
- Value / Conv.
- Price Competitiveness
Conv. Value / Cost
Conversion value per cost (“Conv. Value / Cost”) is what our team considers to be the MOST valuable PPC KPI, as it helps show how profitable each area of your account is and how well you’re tracking overall. THIS is the bottom line: ROI or ROAS (Return on Ad Spend) in PPC terms.
Conversion value per cost is calculated by dividing your total conversion value (revenue generated) by your total ad spend (cost).
Take the below as an example. Here, our total conversion value is $255,000, and our total cost (ad spend) is $35,300.

So we take $255,000 / $35,300 = $7.21
Basically, this is telling you that for every dollar you spend on advertising, you’re earning $7.21 back. This is one of those instances where more is most definitely better. The higher your conversion value per cost, the more revenue you’re driving. Pretty straightforward, right?
Conversion value per cost is even more critical given Google’s automation and AI-driven bidding strategies (such as Maximize Conversion Value and Target ROAS), which rely heavily on these metrics to allocate spend efficiently.
Conversion value per cost is a great, hard-hitting KPI to share with your leadership team as it boils down to how profitable (or unprofitable) your PPC campaign has been.
Conv. Rate
While ad clicks and video views are nice, your CEO isn’t going to give a damn about them unless they’re driving revenue. That’s where your conversion rate (“Conv. rate”) comes into play.
Conversion rate is the percentage of clicks on your ad that result in a conversion. It calculates your total number of conversions divided by your total clicks (or other interactions like video views).
In our example below, we have (rounding up) 241 conversions and 14,600 clicks, so we take 241 / 14,600. This gives us a conversion rate of 1.65%.

On average, eCommerce conversion rates are in the 2.5%–3.5% range, but that varies widely by industry, so you’ll want to benchmark yourself against players in your own sector to gauge true performance.
Improving conversion rate is more of a science than an art, involving A/B testing your ad copy, creative, offers, and landing pages. Use Google Ads’ Experiment Tools and Performance Max asset insights to test messaging and creative variations faster than ever—helping you scale high-performing campaigns more efficiently.
Your conversion rate is wildly important to your overall eCommerce PPC management strategy, so if you’re at a loss on how to improve it, it’s often best to engage a Google Ads agency (we may know of one that can help 😉).
Cost / Conv.
Next on the list of PPC KPIs to track is the cost per conversion (“Cost / Conv.”). We like to think about Cost per Conversion as how much you need to spend before you see a conversion — in other words, how efficiently your ad dollars are working for you.
In a nutshell, it’s a way to look at the average cost for each conversion. To calculate cost per conversion, just take your total cost (ad spend) and divide it by your total conversions.
Ready for some more math?
Using the example below, we’ll take $35,300 (cost) / 241 (conversions).
That gives us a “Cost / Conv.” of $147.

Cost per Conversion is something you’ll want to track over time and use as a benchmark metric to inform your campaign budgets and bidding strategies. Of course, several factors will come into play — such as industry competition, seasonality, and device performance — but having a solid understanding of your Cost / Conv. trends will help tremendously for planning and forecasting purposes.
Google’s automated bidding strategies (like Target CPA and Maximize Conversions) rely heavily on this data. Regularly monitoring Cost / Conv. allows you to identify when automation may be over- or under-bidding and make adjustments to stay within profitable thresholds.
Pro Tip: If your Cost per Conversion is rising but your revenue isn’t, it might be time to review your keyword intent, tighten audience targeting, or optimize your landing page experience.
Value / Conv.
Still with me? Just a couple of more KPIs to get through, I swear!
As you [hopefully] already know, a solid bid strategy is essential when it comes to eCommerce PPC management, and that is why value per conversion (“Value / Conv.”) is so critical. When determining how much to bid, you MUST look at your value per conversion metric. It is an absolute must.
Value per conversion shows, on average, how much a conversion is worth. Calculate this metric by taking your total conversion value divided by your total number of conversions, as noted in the formula below.
“Conv. Value” / “Conversions”
Let’s say you have a conversion value of $100,000 and 4,000 conversions. Your value per conversion would be $25 ($100,000 / 4,000 = $25).
We like to look at value per conversion in conjunction with cost per conversion (“Cost / Conv.”). If you only make $25 with each conversion, and your “Cost / Conv.” is $20, you are significantly eating into your margins–and that is never a good thing.
The good news is that scenarios like the above can be avoided if you know what metrics to track (Phew, you can exhale a sigh of relief now!).
Based on your “Value / Conv” and your “Cost / Conv.,” you can scale your bids up or down to remain as profitable and competitive as possible. AI-powered Smart Bidding strategies in Google Ads rely on accurate conversion values, so make sure you’re tracking revenue data through enhanced conversions or GA4 eCommerce tracking to feed the algorithm high-quality signals.
Pro Tip: Try segmenting your Value / Conv. by product category or audience type in Google Ads to reveal which segments deliver the highest ROI. These insights are gold for scaling profitable campaigns.If you’re not sure where to begin when it comes to your eCommerce PPC bid strategy, you can always ask our PPC experts to give you an assist.
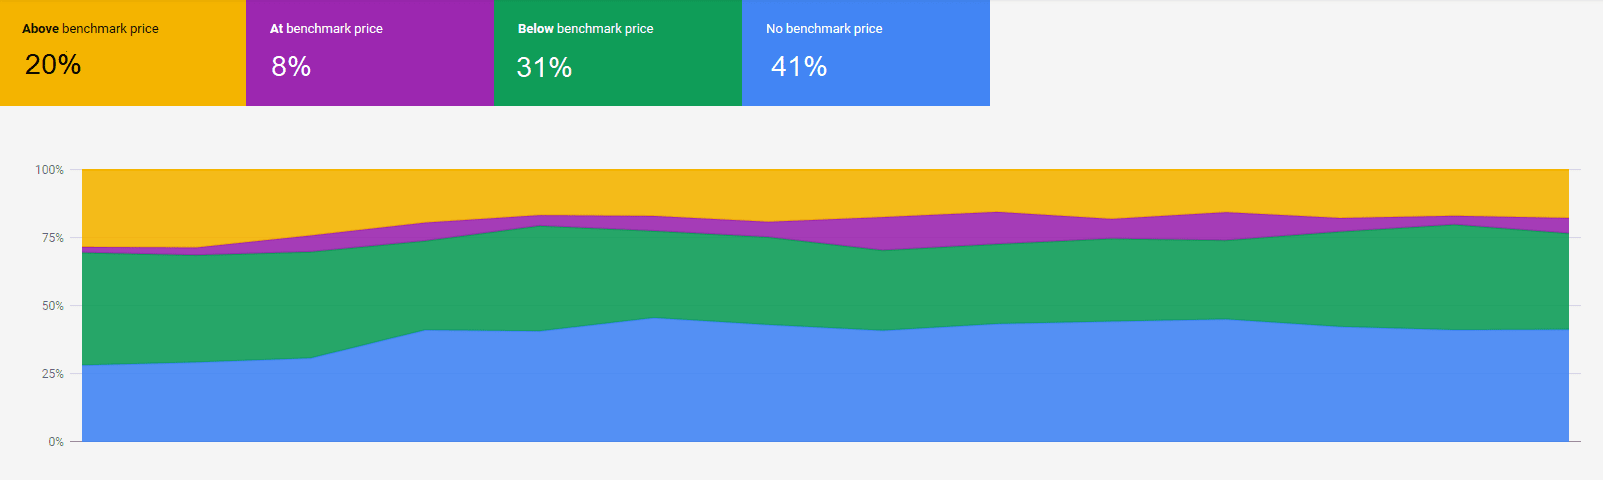
Price Competitiveness
And last but not least (drumroll, please)….we have price competitiveness!
Price Competitiveness is a feature in Google Merchant Center, which helps you analyze how your price compares to your competitors. This data is even more powerful thanks to its integration with Performance Max and Shopping campaign insights, giving eCommerce advertisers direct visibility into price positioning and bid opportunity. Pretty, sweet, huh?
Our team uses price competitiveness to understand which auctions they have a better chance of winning. The report is accessible via your Google Merchant Center account (just navigate to the “Growth” tab, then click “Price competitiveness”). Once you’re in the report, you’ll have the option to group your information by product, product type, category, or brand.
You’ll then see a breakdown (see example below) of how your products rank when benchmarked against your competitors. This allows teams to identify where lower prices can boost conversion rates and impression share, and where raising bids could improve performance without sacrificing profitability.
Google’s algorithm increasingly favors listings with competitive pricing combined with strong ad performance, so this metric has become essential for both feed optimization and PPC bid strategy.
Combine Price Competitiveness data with product-level ROAS reports in Google Ads to identify “sweet spots” — high-performing items that are competitively priced and deliver strong margins. Those are your prime candidates for scaling.
As our eCommerce PPC team will tell you, these kinds of insights are pure gold! In a few simple clicks, you have direct insight into which of your products are price competitive, which in turn tells you where you can (and should) raise your bids.
eCommerce PPC Final Thoughts
With all the self-proclaimed “experts” and misinformation out there, if anything, we hope this article helps clarify what KPIs are truly the most important when it comes to your eCommerce PPC management strategy. As our PPC experts can attest, if you aren’t tracking the right metrics, you’re never going to run a winning eCommerce PPC campaign. Fact.
We know how challenging it is to build a highly successful eCommerce PPC campaign, so if you have questions or need advice, feel free to reach out to our team of PPC experts! In the meantime, you can learn more about our PPC management services here.
Until next time, start tracking those KPIs so you can CRUSH your eCommerce goals this year!
