
Page speed looks simple until you have to decide what to fix first. A page either feels fast or it does not, but the metrics behind that feeling can point in different directions.
Some page speed metrics help you diagnose real SEO and user-experience problems. Others are useful context, historical artifacts, or vanity metrics that can make a page look healthier than it feels.
That distinction matters. A page can show something on the screen quickly but still take too long to load the main content. It can look complete but ignore a user’s first click. It can score well in one lab test and still frustrate real visitors on slower phones, crowded networks, or script-heavy templates.
This guide updates the original page speed metrics framework for the current SEO environment: Core Web Vitals, PageSpeed Insights, Search Console, field data, lab data, and the supporting diagnostics that help your team find the actual cause.
Page Speed SEO Metrics: The Short Answer
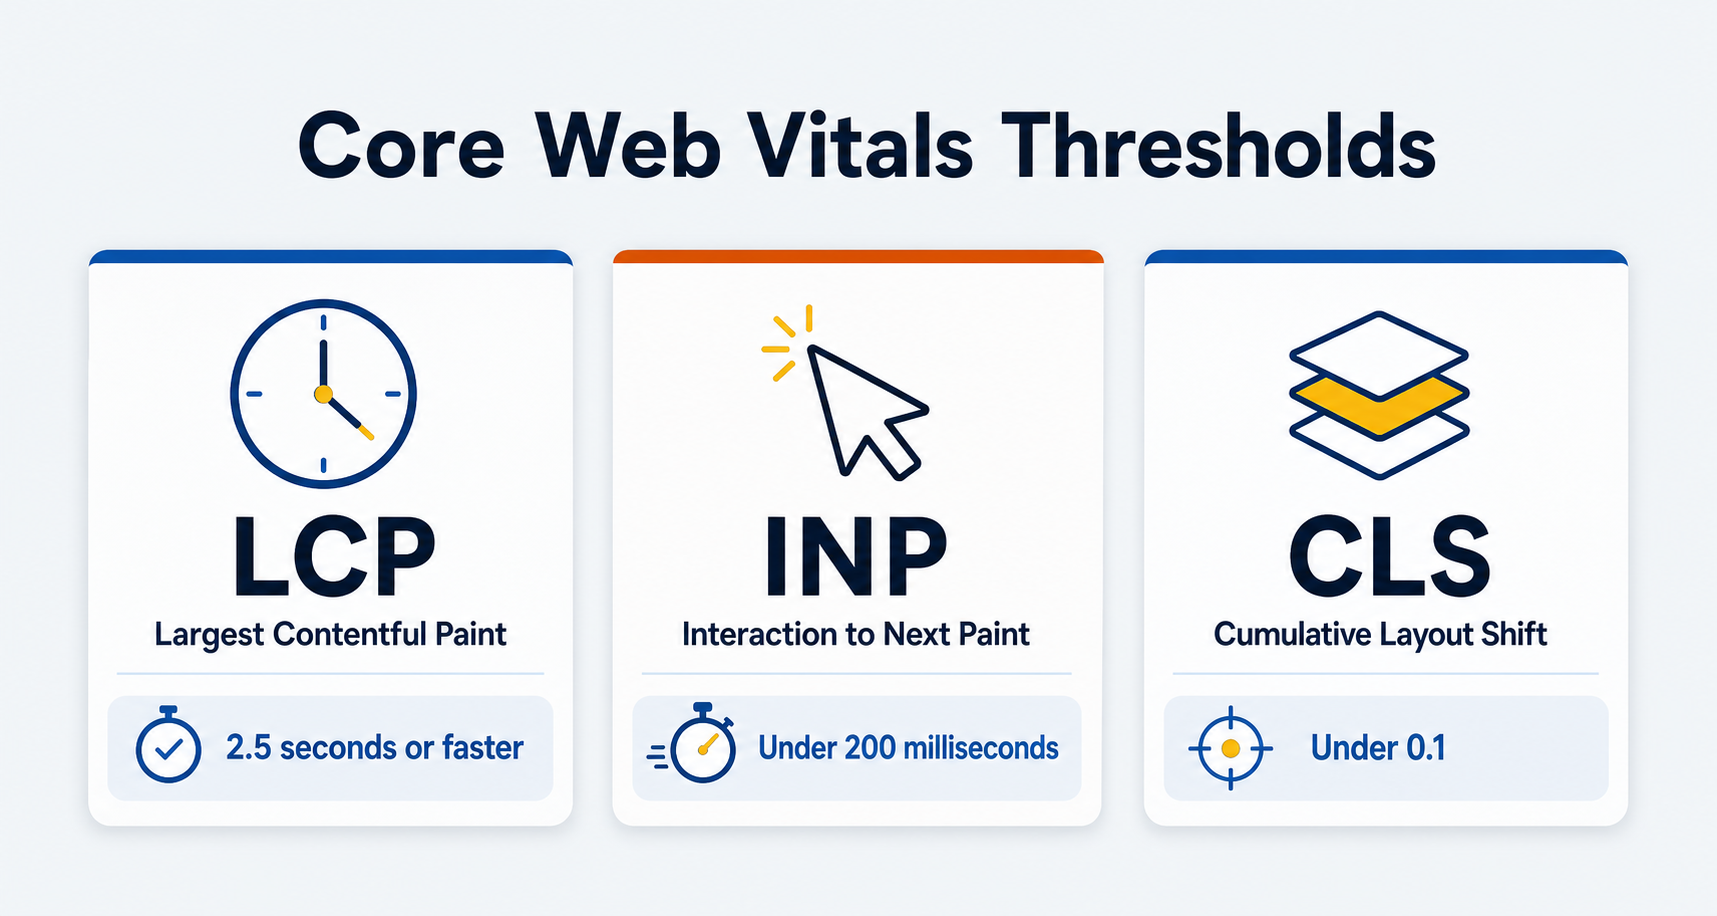
The page speed metrics that matter most for SEO are Largest Contentful Paint (LCP), Interaction to Next Paint (INP), and Cumulative Layout Shift (CLS). Google groups those three as Core Web Vitals because they measure real-world loading performance, responsiveness, and visual stability.
Those are the first metrics to watch, but they are not the only metrics worth reading. First Contentful Paint, Time to First Byte, Speed Index, Total Blocking Time, page load time, and request/resource counts can all help explain why a page is slow.
The practical answer is this: use Core Web Vitals to decide whether the user experience is healthy, then use supporting page speed metrics to diagnose the cause. PageSpeed Insights, Search Console, CrUX or real-user monitoring, developer tools, and GA4 all answer different parts of the question.
Why Page Speed Still Matters for SEO
Page speed for SEO is not about chasing a perfect score. It is about whether search visitors can load, read, interact, and move through the page without friction.
Google’s Core Web Vitals guidance says the metrics measure real-world user experience for loading, interactivity, and visual stability. Google also recommends good Core Web Vitals for Search success and user experience generally, while framing page experience as one part of what ranking systems seek to reward.
That wording is important. A faster page does not outrank every slower page by default. Relevance, content quality, links, intent fit, and technical accessibility still matter. But when two pages are otherwise competitive, speed and page experience can become the difference between a page users finish and a page users abandon.
Speed also affects the work around SEO. A slow product category page can lower crawl rate over time, weaken engagement, and undercut conversion paths. A heavy article template can make strong content feel harder to read. A sluggish JavaScript experience can make a page look loaded while the next click still fails.
That is why page speed belongs inside a broader technical SEO program instead of living as a one-time Lighthouse cleanup.
Field Data vs. Lab Data
Before you read any page speed report, separate field data from lab data.
Field data comes from real users. PageSpeed Insights uses the Chrome User Experience Report, or CrUX, when enough data is available, and reports real-user experiences over a previous 28-day collection period. Field data is the better signal for whether visitors actually experience the page as fast or slow.
Lab data comes from a controlled test. Lighthouse runs in a simulated environment and gives you repeatable diagnostics. Lab data is useful because it can expose render-blocking resources, JavaScript delays, unused code, image problems, and other causes you can fix.
The original article compared basic speed checks to a doctor checking a heartbeat. That analogy still works. A heartbeat tells you something about overall health, but it is not a diagnosis. Field data tells you whether users have a problem. Lab data helps you understand why that problem exists.
You need both. Field data keeps you honest about real users. Lab data gives developers and SEOs the clues they need to fix the page.
Core Web Vitals: The Three Page Speed Metrics to Watch First
Core Web Vitals are the current starting point for SEO page speed work. PageSpeed Insights and Google Search Central list these good thresholds:
| Metric | What It Measures | Good Target | What Problems Usually Mean |
|---|---|---|---|
| Largest Contentful Paint (LCP) | How quickly the main content appears | 2.5 seconds or faster | Slow server response, render-blocking code, heavy hero media, delayed fonts, or late-loading main content |
| Interaction to Next Paint (INP) | How quickly the page responds to interactions | Under 200 milliseconds | Long JavaScript tasks, heavy third-party scripts, large DOM updates, layout work, or client-side rendering delays |
| Cumulative Layout Shift (CLS) | How visually stable the page is | Under 0.1 | Images without dimensions, injected banners, late-loading ads/embeds, font swaps, or dynamic content pushing the layout |
The goal is not to make every page perfect at once. The goal is to find the templates and URLs where poor Core Web Vitals overlap with rankings, traffic, leads, revenue, or important user tasks.
Largest Contentful Paint (LCP)
Largest Contentful Paint measures when the main content on the page has likely loaded. It is usually tied to the biggest visible image, hero block, heading area, or text block above the fold.
This metric replaced some of the older “meaningful paint” thinking because it gets closer to what the visitor came to see. No one visits a page just to see the background color, a logo, or a navigation bar. They came for the product grid, article answer, service explanation, comparison table, or form path.
Poor LCP often comes from one of four places:
- The server takes too long to start sending the page.
- CSS, JavaScript, or font loading blocks the browser from rendering the main content.
- The LCP image or hero asset is too heavy, discovered too late, or lazy-loaded when it should be prioritized.
- The browser has the resource but still cannot render it quickly because layout or styling work is delayed.
That is why LCP fixes vary by page type. An article may need cleaner font loading and a smaller hero image. An ecommerce category may need better image sizing, server response, and template code. A custom application page may need JavaScript and rendering changes before the main content can appear quickly.
Interaction to Next Paint (INP)
Interaction to Next Paint measures responsiveness. It looks at how long the page takes to respond after a user interacts with it, such as clicking a button, opening a menu, selecting a filter, typing in a field, or tapping an accordion.
INP is now the interaction metric to prioritize. The Chrome team announced that INP officially became a Core Web Vital and replaced First Input Delay on March 12, 2024. That means old FID-based guidance should be treated as historical unless you are reviewing older reports.
The practical issue is simple: a page can appear loaded but still feel broken. A visitor taps a filter, nothing changes, and then the page reacts a moment later. A shopper opens a size selector, but a long JavaScript task blocks the response. A lead form accepts the first click slowly because scripts are still competing for the main thread.
Poor INP often comes from:
- Long JavaScript tasks.
- Heavy third-party tags.
- Client-side rendering that keeps the main thread busy.
- Large or complex DOM updates.
- Layout thrashing caused by scripts that repeatedly read and write layout.
- Expensive CSS selector or rendering work after an interaction.
INP is one reason “the page loaded” is not enough. The page has to be usable when the visitor tries to act.
Cumulative Layout Shift (CLS)
Cumulative Layout Shift measures visual stability. It captures how much visible content unexpectedly moves while the page loads or while the visitor is trying to interact.
CLS problems feel small until they cost trust. A button jumps just as someone taps it. A paragraph shifts downward when an image finally loads. A cookie banner, ad slot, review widget, or embedded video appears late and pushes the content out of place.
Common CLS causes include:
- Images, videos, iframes, or embeds without reserved dimensions.
- Fonts that swap after text has already rendered.
- Ads or banners injected above existing content.
- Accordions, forms, or personalization blocks that load without reserved space.
- Lazy-loaded sections that change height after the initial layout.
CLS is not only a design polish metric. It affects whether users can trust the page enough to keep reading, compare, fill out a form, or purchase.
Supporting Page Speed Metrics That Help Diagnose the Problem
Core Web Vitals tell you where to start. Supporting metrics help explain what is happening.
First Contentful Paint (FCP) measures when the first useful text or image appears. FCP can help identify a blank-screen problem, but it does not prove that the main content has loaded or that the page is ready to use.
Time to First Byte (TTFB) measures how long it takes the server to send the first byte of the response. A slow TTFB can drag down LCP because the browser cannot render what it has not received.
Speed Index estimates how quickly visible content is populated during the load. It is useful for comparing lab tests, but it should not outrank field Core Web Vitals in your decision-making.
Total Blocking Time (TBT) is a lab metric that helps diagnose main-thread blocking between FCP and interactivity. It is not the same as INP, but it can point developers toward JavaScript work that may hurt responsiveness.
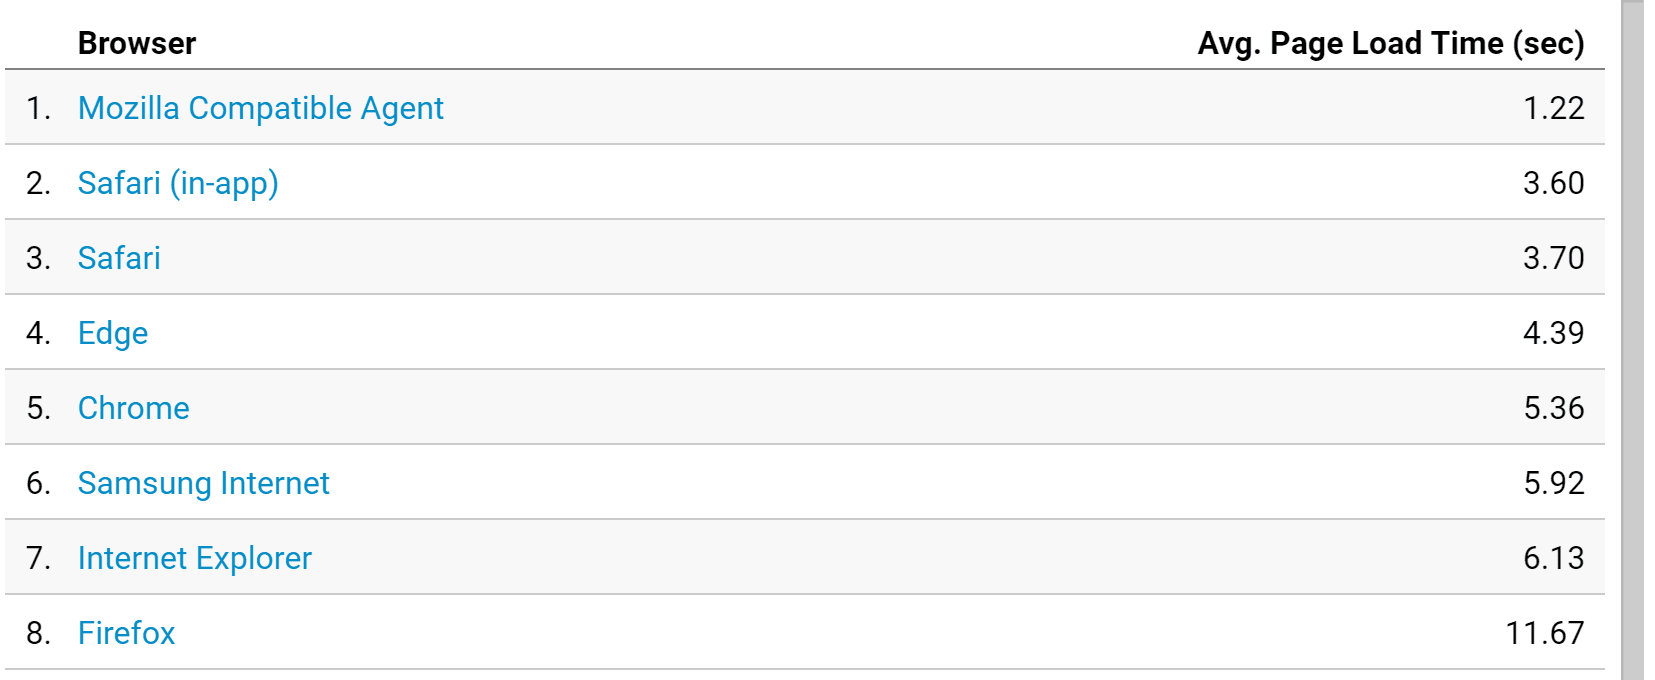
Page load time measures how long the page takes to complete the full load event. It is still a useful high-level signal, especially when tracked consistently, but visitors often see and use important content before every script, tracking tag, image, and background request finishes.
Request count and resource weight show how much the page has to fetch. The old article’s HTTP request point still matters, but the modern question is more nuanced than “fewer requests is always better.” Large uncompressed images, render-blocking scripts, unused JavaScript, font files, tag managers, and third-party embeds can all create different bottlenecks.
These metrics are diagnostic tools. They help you find the cause after Core Web Vitals or user behavior tells you the page has a problem.
Page Speed Metrics That Changed: FID, TTI, FMP, and First CPU Idle
Some metrics from older page speed reports are still useful to understand, but they should not drive a current SEO workflow.
First Input Delay (FID) measured the delay before the browser could respond to a user’s first interaction. It was useful, but it missed interactions that happened later in the visit. INP replaced FID as the Core Web Vital for responsiveness on March 12, 2024.
Time to Interactive (TTI) tried to measure when the page became reliably interactive. It can explain older Lighthouse reports, but modern PageSpeed work usually looks at INP, Total Blocking Time, long tasks, and field responsiveness instead.
First Meaningful Paint (FMP) tried to identify when primary content appeared. It helped explain why decorative paint was not enough, but LCP is the current metric that better captures main-content loading.
First CPU Idle described when the page became minimally interactive. It is another historical Lighthouse term, not a priority metric for current SEO reporting.
The lesson from those older metrics survives: visible content, useful content, and usable content are not the same thing. The metric names changed because the measurement got better.
Where to Measure Page Speed
Use more than one tool because each tool answers a different question.
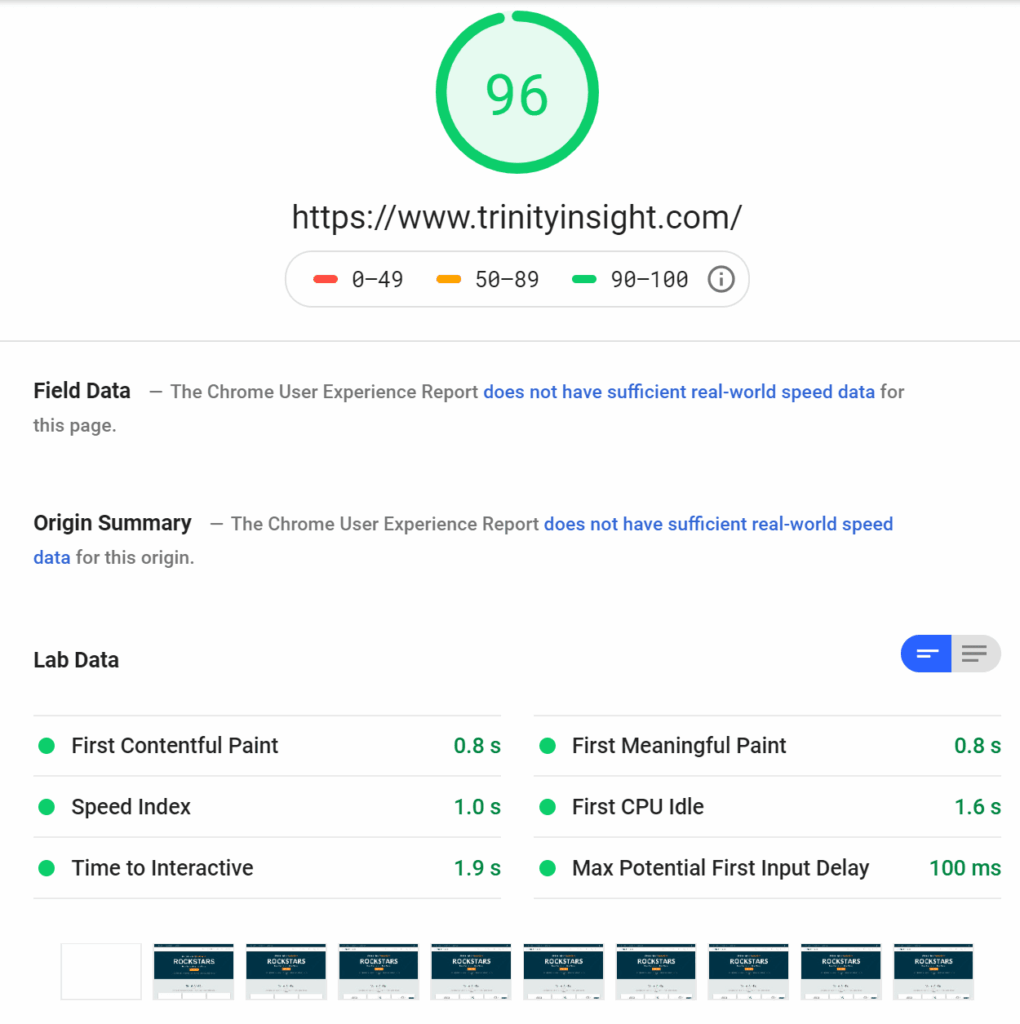
PageSpeed Insights is the best starting point for most SEO teams. It combines field data when available with Lighthouse lab diagnostics. It also separates mobile and desktop, which matters because mobile users often experience slower devices and network conditions.
Search Console Core Web Vitals helps you find groups of URLs with similar field-data problems. This is useful for template-level work because a single article, product, category, or service-page template may affect dozens or thousands of URLs.
GA4 helps you decide whether speed problems matter to business outcomes. GA4 is not a direct replacement for the old Universal Analytics Site Speed reports, but engagement rate, conversion events, landing page performance, and revenue paths can show whether slow templates overlap with important sessions.
Real-user monitoring can capture your own field data when CrUX is too broad, too delayed, or unavailable for lower-traffic URLs. This is especially useful for logged-in experiences, checkout flows, account portals, and B2B ecommerce workflows.
Developer tools and Lighthouse help diagnose the cause. They are where your team can inspect the LCP element, main-thread tasks, layout shifts, render-blocking resources, request waterfalls, and JavaScript behavior.
How to Prioritize Page Speed Fixes
Do not start by fixing every red audit in PageSpeed Insights. Start by deciding which pages and templates matter.
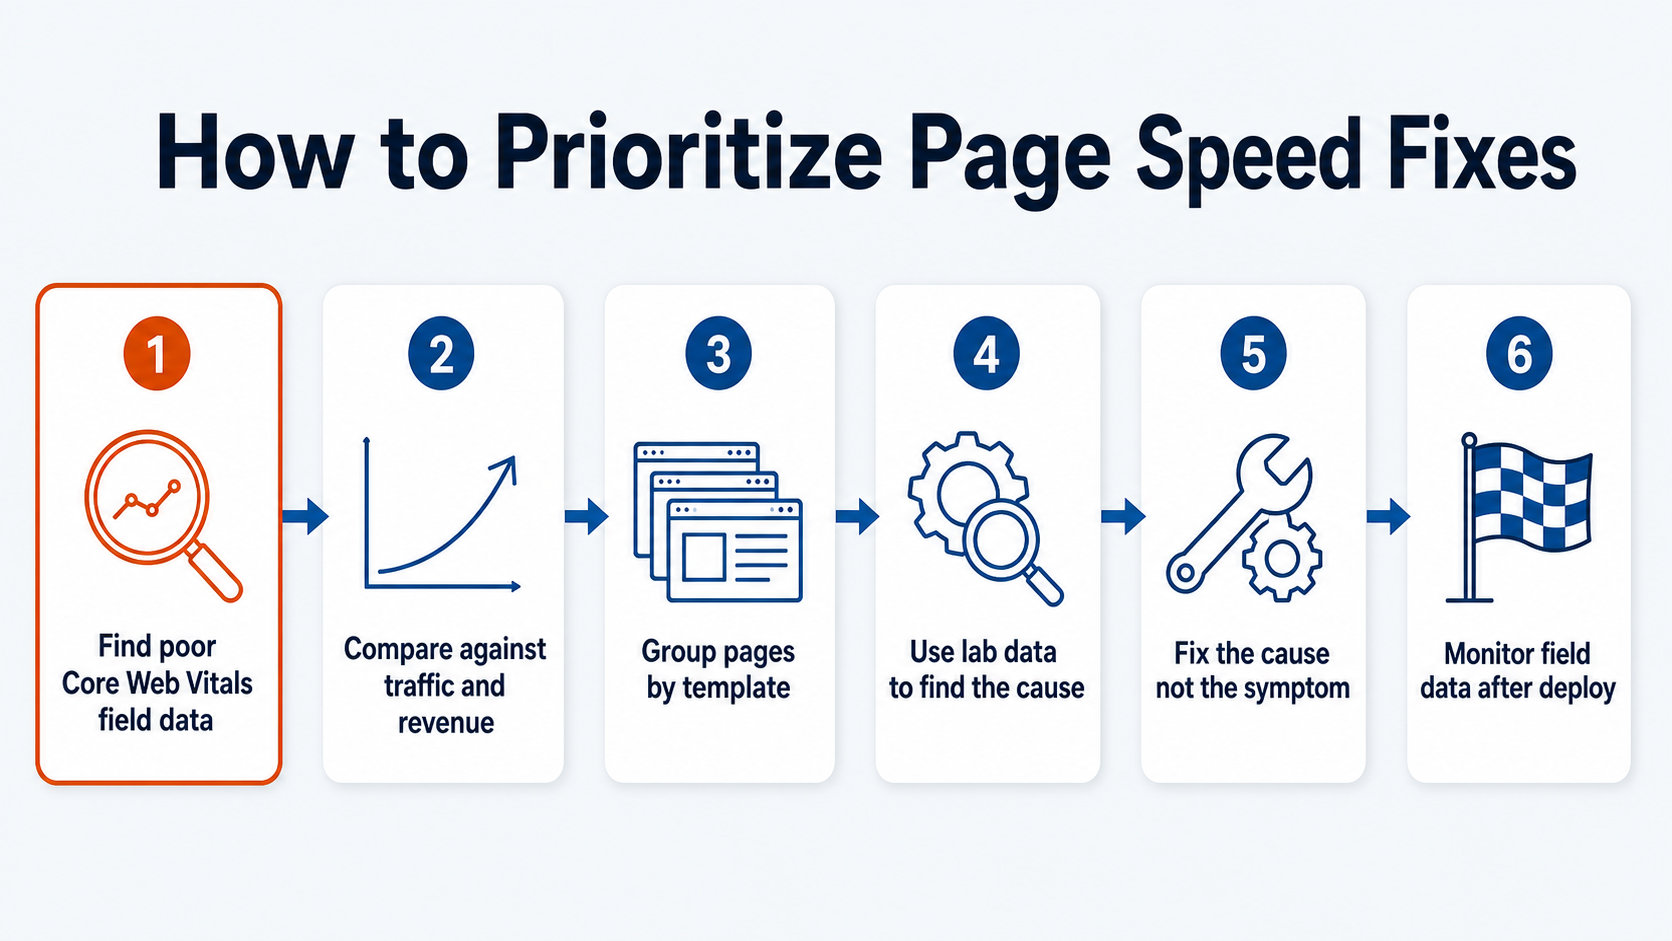
A practical prioritization process looks like this:
- Find URLs or templates with poor Core Web Vitals field data.
- Compare those URLs against organic traffic, rankings, leads, revenue, or assisted conversion paths.
- Group pages by template so one fix can improve many URLs.
- Use lab diagnostics to identify the likely cause.
- Fix the cause, not the symptom.
- Monitor field data long enough to confirm the real-user experience improved.
For SEO, this often means prioritizing page types such as product categories, service pages, high-traffic articles, comparison pages, lead-generation landing pages, and checkout or quote paths. A slow page with no rankings, no traffic, and no business role may not deserve the same attention as a slow category template that supports hundreds of ranking keywords.
This is also where page speed and conversion statistics become useful context. Speed work should connect to the pages where visitors make decisions, not just to a sitewide average.
Common Causes of Poor Page Speed Metrics
Different metrics fail for different reasons, but recurring patterns show up across many sites.
Heavy above-the-fold assets create bottlenecks when they are oversized, poorly compressed, served in the wrong format, discovered late, or lazy-loaded when they should be prioritized.
Render-blocking code slows the first meaningful view when CSS, JavaScript, fonts, or third-party dependencies stop the browser from showing the main content.
Unmanaged third-party tags can hurt both loading and responsiveness. Chat widgets, personalization tools, analytics tags, ad scripts, review widgets, heatmaps, and A/B testing tools all compete for browser resources.
Slow server response drags down the whole timeline. Caching, hosting, database queries, application logic, redirects, and CDN configuration can all influence TTFB and LCP.
Unreserved layout space creates instability when images, embeds, banners, ads, or dynamic modules load after the browser has already drawn the page.
JavaScript-heavy rendering hurts INP when the main thread stays busy after the page appears. This is common on sites with large app bundles, complex filters, client-side route changes, and heavy personalization.
The best fix depends on the bottleneck. Compressing images will not solve a long-task INP problem. Removing unused JavaScript will not fix missing image dimensions. A useful speed audit names the metric, the affected template, the likely cause, and the fix path.
Improve Your Page Speed With OuterBox
Page speed starts as a metric problem, but it usually becomes a technical SEO, development, design, analytics, and conversion problem. The right fix depends on the template, the platform, the code, the traffic source, and the business role of the page.
OuterBox can help identify which page speed metrics are holding back your most important pages and turn the findings into practical fixes. If Core Web Vitals, JavaScript, image weight, server response, or template performance are limiting your organic growth, our SEO services and technical team can help you decide what to fix first.
